| Tool from JDK | Scope |
|---|---|
| jcmd | Basic class, thread, VM information for a java Process |
| jconsole | Graphical view of JVM activities (thread, class, GC) |
| jhat | Reads and analyze memory heap dumps => postprocessing utility ( after application finishes) |
| jmap | Heap dumps and other information about JVM memory usage |
| jinfo | View / set (dynamically) system proprties of JVM |
| jstack | Dumps stacks of Java Process |
| jvisualvm | GUI tool to monitor JVM, profile running application, analyze heap dumps (can be live / postprocessing) |
Basic VM Information
Uptime
length of time JVM has been up
% jcmd process_id VM.uptime
System Proprties
jcmd process_id VM.system_properties

// or

jinfo -sysprops process_id
JVM Tuning Flags
jcmd procses_id VM.flags [-all]

// Viewing flags on a platform
% java other_options -XX:+PrintFlagsFinal -version
...Hundreds of lines of output, including...
uintx InitialHeapSize                          := 4169431040     {product}
intx InlineSmallCode                           = 2000
note
Colon indicates that a non default value is being used
- Flag's value specified directly on command line
- Some other option indirectly changed that option
- JVM calculated the default value ergonomically
Working with tuning flags
// Inspecting value of individual flag
% jinfo -flag PrintGCDetails process_id
-XX:+PrintGCDetails

// jinfo can change the value of any fdlag, but that doesn't mean JVM will respond to the change => based on which flags are marked manageable
% jinfo -flag -PrintGCDetails process_id  # turns off PrintGCDetails
% jinfo -flag PrintGCDetails process_id
-XX:-PrintGCDetails
Thread information
note
Information can be displayed in real time => determine if certain threads are blocked
// Obtaining stacks of a process
% jstack process_id

% jcmd process_id Thread.print
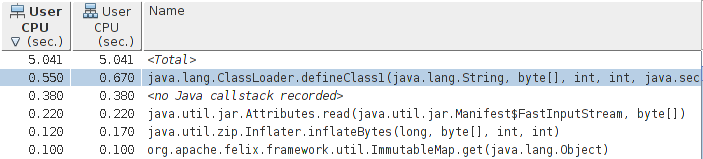
Profiling Tools
- Most important tool
- Work by attaching themselves to a Java application and exchanging information through a socket
- Profiler must have sufficiently large heap
- Run the profiling tool with a concurrent GC algorithm
- Ill timed pauses can cause data overflow
- Occurs in 2 modes
- Sampling: sth like taking snapshots
- Instrumented
note
There are many different profiling tools so it makes sense to use different tools
Different profilers might find different problems on the same application
warning
Profiling will alter the performance characteristics
You must hence limit the impact of profiling to more closely model how application normally behaves
info
Read the detailed analysis in the book for a better understanding, too much to summarise here
Sampling Profilers
- Most common kind of profiler
- Introduce fewer measurement artifacts because of relatively low profile
- Different sampling profiles behave differently
- Can be subject to all sorts of errors
Instrumented Profilers
- Yield more information about an application
- Work by altering bytecode sequence of classes as they are loaded
- Inserting code to count invocations etc.
- Much more likely to introduce performance differences => should be set up to instrument small sections of the code
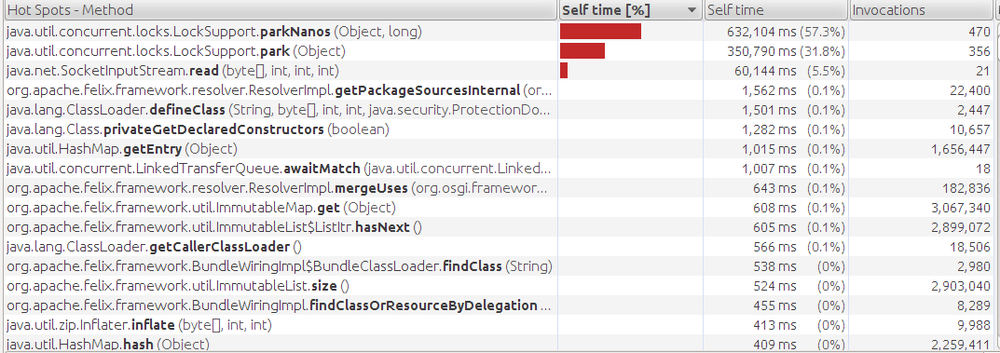
Blocking Methods and Thread Timelines
- Threads that are blocked may or may not be a source of performance issues => necessary to examine why they are blocked
- Blocked threads can be identified by the method that is blocking / timeline analysis of the thread
Native Profilers
- Provide visiblity into both JVM / application code
- If native profilers shows that time in GC dominates CPU usage => should tune collector
- If significant time spent in compilation threads => application's performance not affected